I could log every architectural event. I still couldn’t see the model.
The data was complete. My understanding was not.
Every head split, merge, prune, layer addition, parameter count, loss value, and gradient norm had been logged. I could locate any individual event. What I could not do was answer a simpler question: what shape did the network become, and how did it get there?
A conventional training dashboard assumes the architecture is fixed. Its x-axis is time and its main question is whether optimization is improving a metric. A dynamically structured model adds another evolving object: topology. A loss curve can show instability after a rewrite, but it cannot show which layer gained heads, where parameters accumulated, or whether a later prune reversed an earlier growth decision.
The recording model
npviz writes four append-only JSON Lines files into each run directory. snapshots.jsonl records architecture state such as layer count, per-layer head count, and parameters. events.jsonl records structural operations, their location, reason, and optional loss before and after the change. importance.jsonl stores per-head scores. metrics.jsonl stores loss, gradient norm, and learning rate.
Append-only files matter during live training: a recorder can add one line without rewriting the history, and the viewer can reload a partially complete run. It also keeps the format inspectable with ordinary command-line tools instead of hiding state in a database.
recorder.log_rewire(RewireEvent(
    step=5000,
    event_type="prune_head",
    layer_idx=4,
    head_idx=2,
    reason="importance below threshold",
    loss_before=1.82,
    loss_after=1.91,
))
Six linked views instead of one perfect chart
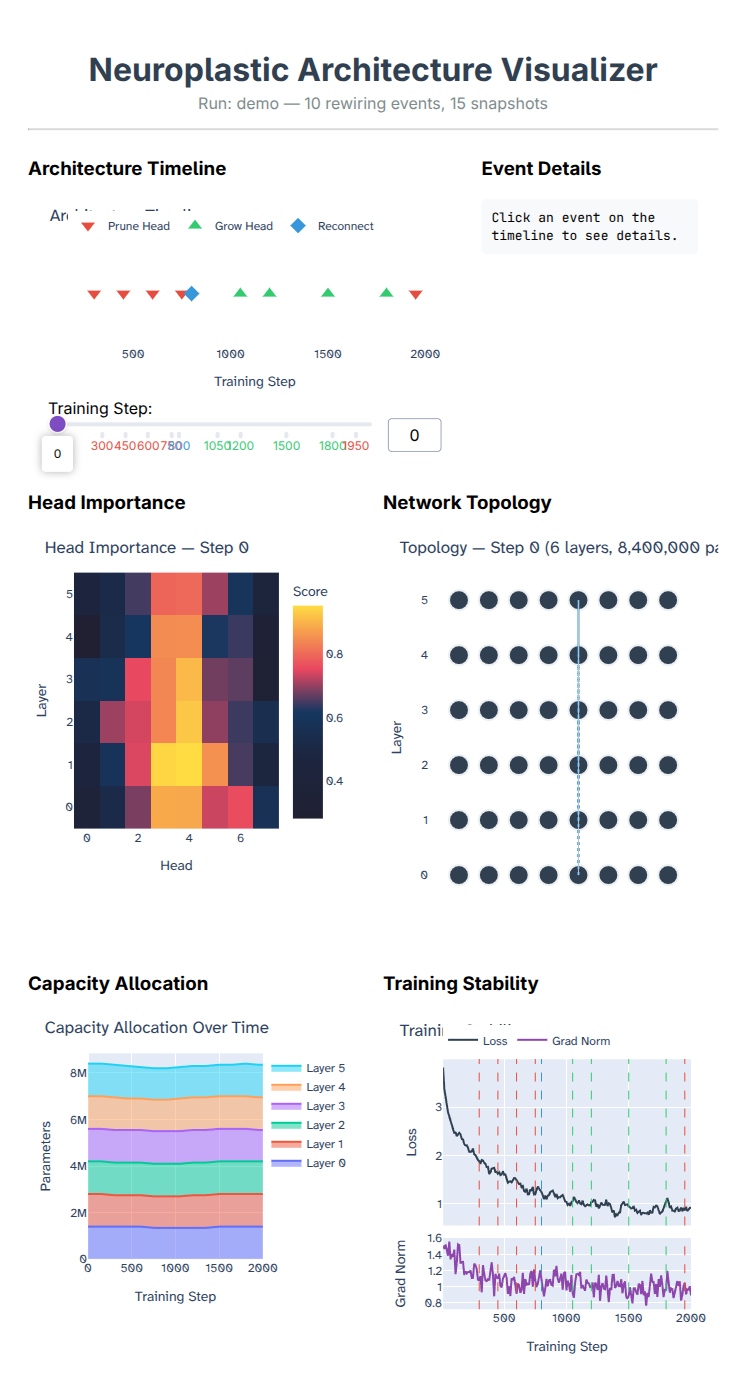
The interface is organized around six different questions. The architecture timeline locates every rewrite. Event detail explains what changed, where, why, and its immediate loss impact. Head importance displays score distributions as a heatmap. Network topology renders the selected step’s actual layer/head shape. Capacity allocation shows parameters per layer over time. Training stability overlays rewiring markers on loss and gradient norm.
The step scrubber connects these views. Selecting a point in the run updates topology, importance, event context, and capacity together. The goal is not animation for its own sake; it is to preserve temporal context while moving between different representations of the same state.
Separating observation from one model
The first data came from the Neuroplastic Transformer, but hard-coding its classes would have made the tool a one-off visualization. npviz separates a generic Recorder and event schema from model adapters. A PyTorch adapter can introspect a model, while auto_detect(model) selects a compatible adapter when possible. The recorder attaches to the adapter and asks it for snapshots rather than importing the model’s internal implementation.
A separate Torch-Pruning integration wraps a structured pruner and records changes through a callback. That provided a useful test: could the same data model describe a network shrinking, not only one growing?
The ResNet-56 pruning case
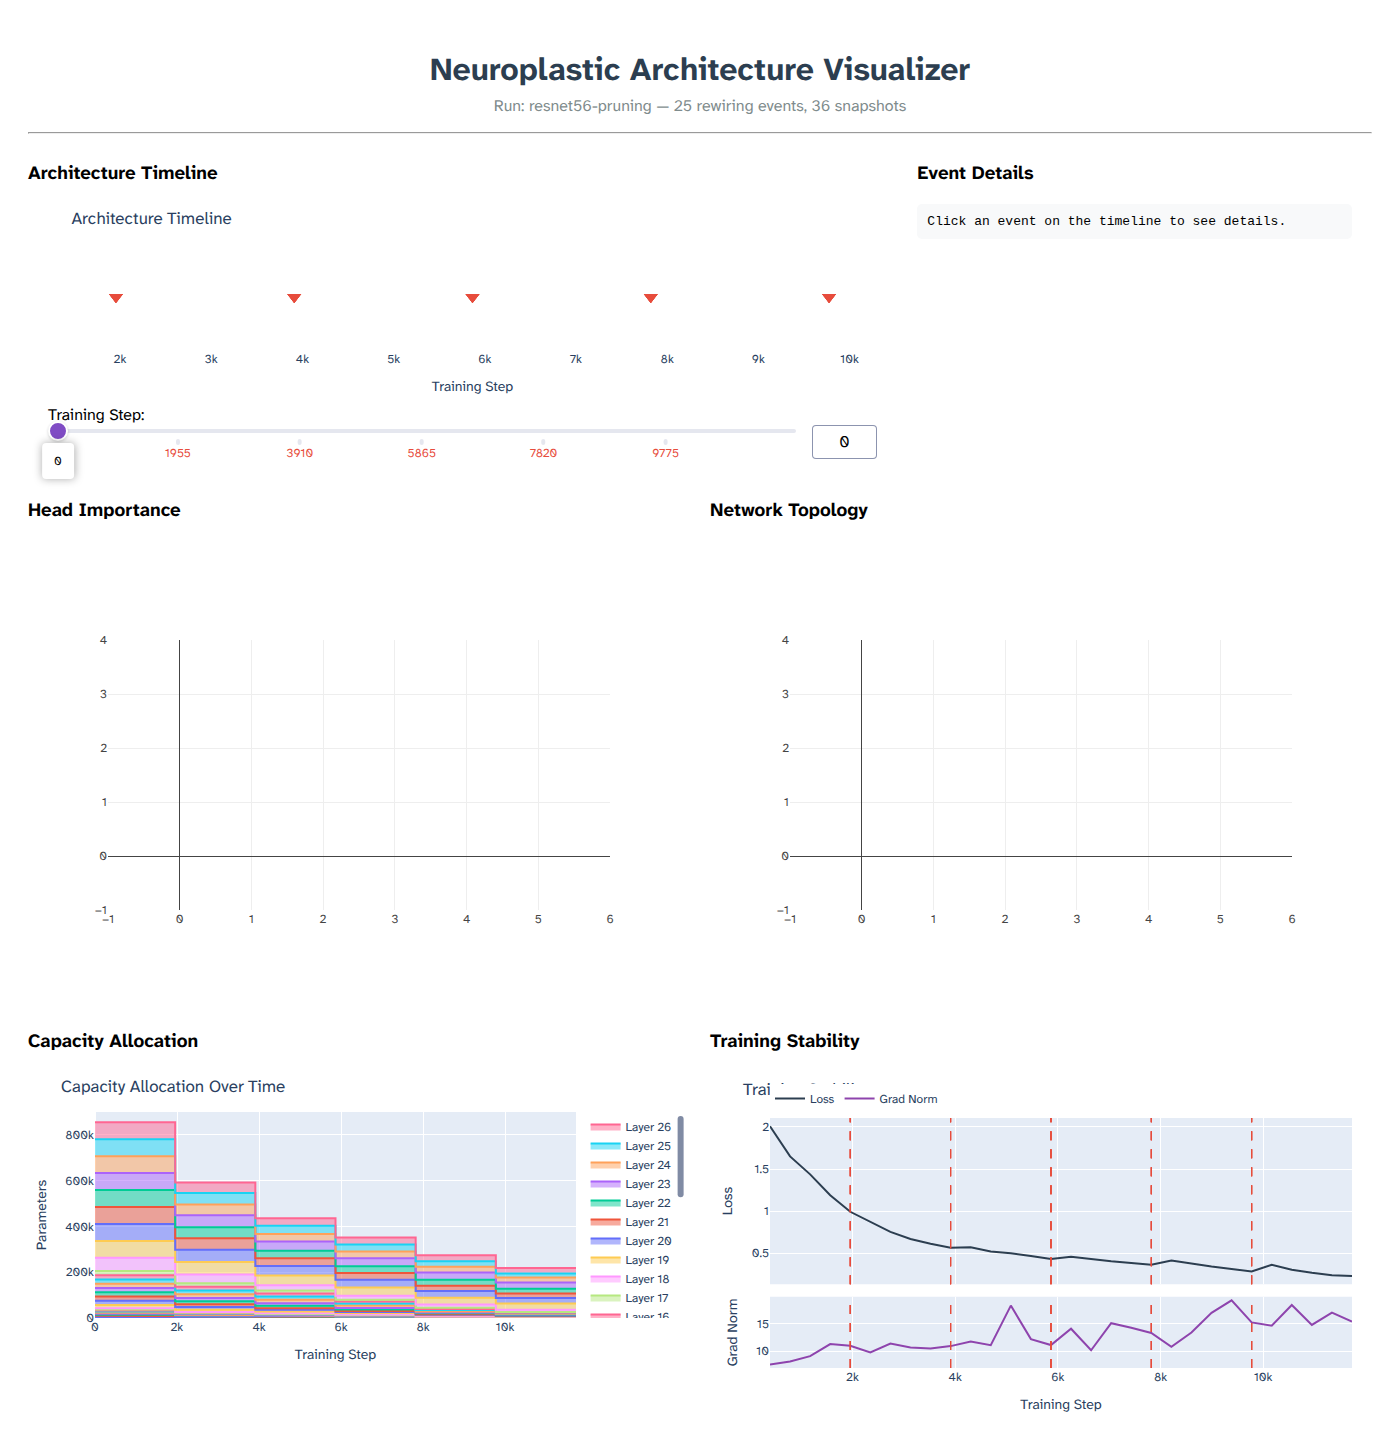
The included example trains ResNet-56 on CIFAR-10 and applies global L1-magnitude structured pruning every five epochs. Each of five rounds removes 15% of the remaining channels globally. Over 30 epochs the model moves from 855,770 parameters to 218,643—a 74.5% reduction—and reports 87.4% test accuracy after recovery.
The capacity view makes the asymmetry visible. Global pruning does not remove the same fraction from every layer; layers with weaker L1 importance lose more channels. The stability view then shows whether accuracy and loss recover between rounds.
Outputs beyond the live dashboard
The CLI serves a run with python -m npviz serve <log_dir>, prints summaries, exports SVG/PDF/PNG figures, and renders architecture videos with selectable scenes and quality levels up to 4K. The same event history therefore supports live inspection, paper figures, and a time-based presentation without separate logging code.
What remains unresolved
Visualization can make a controller legible without making its decision correct. Importance scores inherit the assumptions of the underlying metric; topology drawings become dense as models scale; appending every score too frequently can create substantial logs; and immediate loss impact does not capture a rewrite’s long-term value. A serious next version needs sampling policies, schema versioning, comparisons between importance measures, and explicit support for distributed recorders.